Today let’s try to use JMeter with ArcGIS Server a bit more. Previously, we have set up a test configuration where “users”, or threads, sends a map request to get back an image in a certain extent. As you probably know, map services often contain data that can be distributed unevenly. In built-up areas there will probably be more features with more complex symbology and in rural areas there are usually fewer features. This implies that the server will need to perform a larger amount of work for generating an image over the built-up areas compared to the map image request jobs that will be submitted over rural areas.
That is why it is so important to make your requests as diverse as possible by asking the map service to generate map image in various spatial extents and map scales. In an earlier blog post, we have created an HTTP Request configuration element where we have specified a certain URL to be sent to the server, where the bounding box (or extent) is hard-coded. This means that all the test threads will ask the service to generate the same image all over the time which will lead to a fairly equal burden on the server system resources. In reality, however, the server will likely experience different load since the users will navigate the map service in different scales and extents thus generating different images.
Here is where using a .csv file comes into play. Instead of specifying the same map extent and scale in the request URL, we will ask the JMeter to read these values from a .csv file and insert them dynamically into the URL we will specify. Think of this as inline variable substitution if you are comfortable with geoprocessing in ArcGIS Desktop.
Let’s look at the map image request URL:
Here we are interested in bbox parameter as well as mapScale parameter. For bbox the 0,5,10,30 is used (the coordinates of the extent) and for mapScale the 50000000 is used (1:50,000,000 map scale). We, however, would like to generate images over some other extents and in different map scales. To achieve this, we are going to create a really simple .csv file with some columns and rows. A .txt file would also work fine, but to make it a bit more illustrative let’s stick with the .csv file. We generate different extents by specifying various coordinates and map scale. You can go ahead here and generate as many extents and scales as required!
A sample .csv file would look like this.

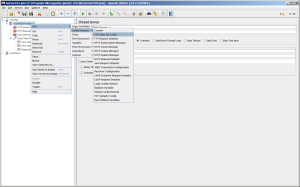
Then you have to right-click the Thread Group, which have called in the previous post Map service image export and choose Add > Config Element > CSV Data Set Config. This will add a new configuration element for which we will set up use of the .csv file.

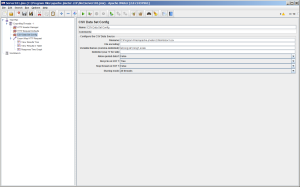
Click the CSV Data Set Config we have just added and fill out the parameters as required.

Filename: specify the location of your file.
Variable Names: the column names you entered in the .csv file.
Delimiter: the comma is used by default
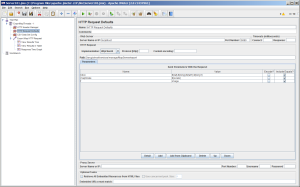
Now click the HTTP Request element which we have called in the previous post Export a map image with bounding box. You can also create an HTTP Request Defaults element which will apply to all HTTP Requests you will specify within your project.
Next you will fill out the parameters as below. The column name in the .csv is used as ${columnname}. The row value that is being read from the .csv file will be inserted in the URL that is sent to the server. This allows us to send various requests to the server by reading values from an external data source.

Feel free to add more parameters like image format and size – you will just need to create a couple more columns in your .csv file and specify them in your test project in JMeter as we did with the mapScale and bbox parameters.
Happy testing!
I just wanted to say that these tutorials are great. Thank you so much for helping us do some testing on our servers!!!!
Thank you, I am glad you like it. I am planning to post a couple of other posts on administering Server 10.1/10.2 by using Python by using httplib (pure REST requests, basically what you can do with Administrator Directory). Do you think this is something you would be interesting to read for you?
Hi Brett! Thank you! Great you find it useful!
Hi Alex, this is perfect. It saved me a lot of time. I was looking for something to load test a tiled service. It took me a while to figure out that I didn’t need to keep the column headers in the csv initially but all working now. The stuff you don’t get with JMeter is the log statistics so after a load test you are only half-way there. For dynamic services I use ESRI System Test tool which gives you a nice spreadsheet after a load test with all the calculations in the end. Have a look at: http://www.arcgis.com/home/item.html?id=e8bac3559fd64352b799b6adf5721d81
Thank you.
Hi Roman, glad you found the info useful. I have seen the Esri System Test tool, but didn’t get a chance to test it yet. Definitely worth a shot. Yet I think Apache JMeter gives somewhat clearer interface when you want to implement some basic workflows and to get familiar with the system test process. Thanks for visiting the blog and good luck!
Hi, Roman! I am glad you found my post useful. Esri System tool is an excellent utility I’ve started using some time ago, too. Happy testing! 🙂
Thanks for the tutorial. These are much better examples than provided by Esri here http://blogs.esri.com/esri/supportcenter/2012/06/14/preparing-for-the-flood-will-your-gis-server-sink-or-swim/
Thank you Fred. My post was originally inspired by the Esri blog post. It is a pity that there are not so many tutorials on testing the ArcGIS system except some utilities published by Esri PS. If I will get a chance to work with the JMeter more, I’d love to publish more posts on that.
I need an example of how to test a GPServer. Anyone know where to find?
Hello Andre! This should not be hard to test. You will have to modify the query to submit a job to a GP service. I recommend going through some docs on the REST API. Once you will comfortable using this from the ArcGIS Services Directory, you will find no problem using the JMeter for this (but maybe you will be OK with shooting multiple queries from the REST Services and simulating submitting many jobs).